How To Create Project Management Graphs?
Project management graphs focus on visualizing the project, understanding where in the project cycle it stands, and meeting deadlines. Whether it be a simple small-scale project or an enterprise-level project, a visual representation of data in the form of Gantt charts, burn-down charts, and flow diagrams plays a great role in realizing the best outcome. Here's a step-by-step guide on how to create effective project management graphs.
How to Draw Graphs for Project Management
1. Choose the Graph You Actually Need
Not all graphs are built for the same purpose. You can visualize the progress of tasks in time using a Gantt chart, and a burn-down chart can help you indicate how much work is left in a sprint. Before you begin graphing, first determine what it is you want to see visualized-whether it be progress, distribution of workload, or adherence to a timeline.
2. Enter Your Project's Data
Once you have selected the graph that would best suit your needs, fill in the information to complete the graph. In the case of Gantt, for example, include the list of tasks, starting and ending dates, and dependencies. Tools like Vabro make it convenient to import data from pre-existing project plans so you do not have to enter information manually to graphically visualize it.
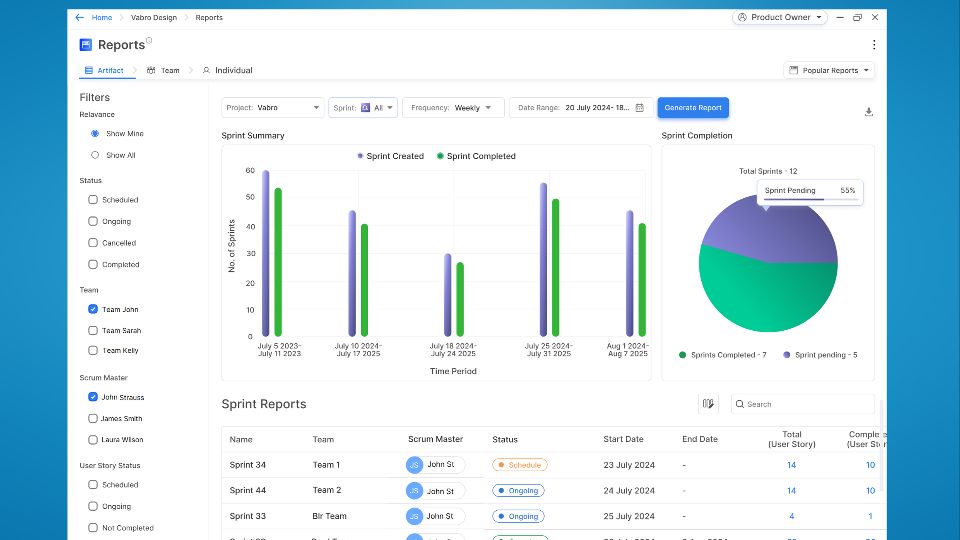
3. Use Project Management Tools
Application of project management tools like Vabro makes creating graphs easy. Vabro lets you create different types of graphs, such as Gantt and task distribution charts, automatically. This tool includes templates that make it easy to convert raw data into reports. The drag-and-drop functionalities within the platform enable one, to make any adjustments needed for the specific needs of his/her project with speed.
4. Update Regularly
In real life, the actual status of the project is continuously updated in your project graphs so as to make valuable decisions.
Why Vabro for Project Management Graphs?
Vabro is the best in project management graph development because of its ease of use, extensive integrations with other tools, and real-time updates. Advanced features of Vabro include automated visualizations of Gantt charts and tasks, making your life easier by streamlining the workflow of your projects. This makes Vabro one of a kind tool, since other tools do not support comprehensive analytics, making it the best for project managers seeking smooth tracking and visual reporting.